












Database Optimizer

See what’s slow in your database, and get it fixed

Cast AI analyzes every PostgreSQL and MySQL query in real time, with no sampling and read-only access, flags the slow ones, and recommends the index or rewrite to ship. When you’re ready, route traffic through the proxy to cache repeated reads and pool connections.

  1. Read-only agent
  2. No credit card required
  3. Live in under 15 minutes
Database OptimizerCaching enabled
PostgreSQL · MySQL
  • Repeated readsReturned from cache, not your database
    Cache hit
  • Connections pooledTraffic spikes stay under your connection limit
    480 → 40
  • Slow query flaggedorders by customer, 1.8 s.Suggested fix: add an index on customer_id
    Review fix

Writes and uncached reads pass through to your database.

Trusted by 2,100+ companies

  • Akamai
  • Yotpo
  • Iterable
  • NielsenIQ
  • Swisscom
  • Kakao
  • FICO
  • BMW Group
  • Hugging Face
  • ShareChat
  • WeWork
  • Cisco
  • PlayPlay
  • Roku

Your database is the bottleneck. Your users notice first.

Slow queries, missing indexes, and connection spikes tend to surface as incidents. Native tools record what your queries do, but turning that raw data into the right fix takes expertise.

80–90%

Cache hit rate with Database Optimizer.

Read the story

From slow queries to steady connections

Continuous query visibility

Cast AI analyzes every query in real time, with no sampling, so you find slow queries and regressions before users report them.

  • Visibility starts on day one: the agent analyzes your workload with read-only access, no proxy or routing changes required.
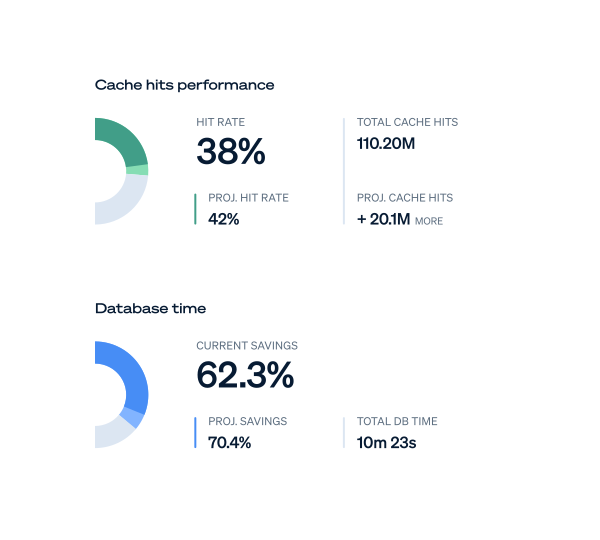
  • One view per database instance shows health, query details, connection stats, cache hit rates, and recommendations.
Index and query recommendations

Cast AI recommends the exact index or rewrite to ship, ranked by the database time it would reclaim.

  • Recommends missing indexes and flags unused ones, based on your actual production workload.
  • Each one includes the exact SQL, a plain-English explanation, and a before and after plan comparison showing the projected impact.

In-memory cache

Serve repeated reads from cache, with no application code changes.

  • Choose how much automation you want: Passthrough observes, Auto decides what to cache, Manual follows your rules.
  • Smart Invalidation parses each write’s SQL and evicts the affected entries as the write passes through, with no WAL access needed.

Connection pooling

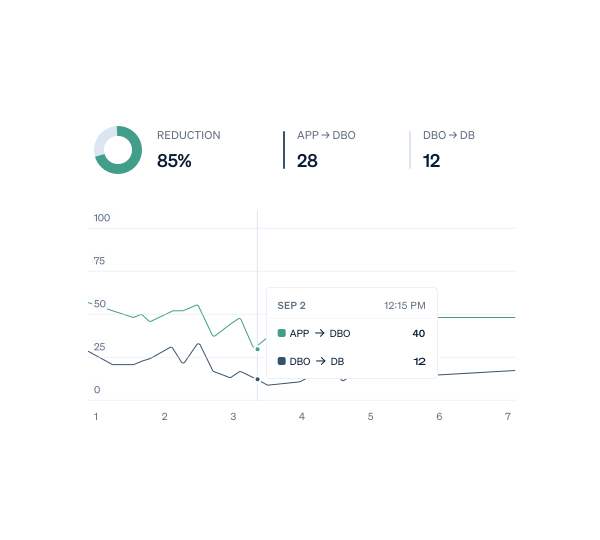
Cast AI multiplexes many application connections onto a smaller pool of database connections, so autoscaling spikes don’t exhaust your limit.

  • Your database sees a steady connection count, whatever your pod autoscaler is doing.
  • Your application only needs an updated connection string.

Start read-only, automate when you’re ready

  1. Read-only

    A lightweight agent with read-only credentials analyzes every query in real time and recommends indexes and rewrites, with the first in 24 to 48 hours.

  2. Validate

    Run the proxy in Passthrough mode to see projected cache hit rates before anything is cached. Each recommendation shows before and after plans.

  3. Automate

    Switch to Auto mode and DBO decides what to cache, or set rules yourself in Manual mode.

Works with the database you already run

Keep PostgreSQL or MySQL, whether you use Amazon RDS, Google Cloud SQL, or a self-hosted database on AWS, Google Cloud, or Azure. Connect through a connection string change, with no migrations or code changes.

01
See how your database is doing.

Connect an instance to see latency, slow queries and connections in one view.

Database health, suggested fixes, query caching, and connection pooling. A read-only DB Agent collects instance and query signals. Example health metrics show query latency, slow queries, and connections. Database PostgreSQL · MySQL Read-only signals Database health Query latency 18 ms Slow queries 3 Connections 59 DB Agent Read-only access Health & query signals

More built in

Automated discovery

Connect a read-only IAM role on AWS or GCP and DBO finds your database instances, or add a single instance by hand.

Best candidate

DBO ranks instances by optimization opportunity and points to the best one to start with, with projected gains.

Kubernetes or ECS

The proxy runs in your Kubernetes cluster, and MySQL deployments also support ECS.

Runs in your infrastructure

Cached data stays in memory in your cluster, and query patterns are analyzed there.

Take the next step

Read how it works, see what other teams got, or talk to a specialist about your setup.

Your questions,
answered

Can’t find what you’re looking for?

Contact us
What is Database Optimizer?

It’s part of the Cast AI platform. A read-only Performance Advisor recommends indexes and query rewrites for PostgreSQL and MySQL, and a proxy caches repeated reads and pools connections.

How does it differ from the native or open-source option?

PostgreSQL’s pg_stat_statements and MySQL’s performance_schema give you raw query data that takes expertise to interpret. The Performance Advisor does that analysis for you and ranks its SQL recommendations by database time reclaimed. If you build your own cache, you also own invalidation. Every write that passes through the proxy triggers Smart Invalidation, which parses the write’s SQL and evicts exactly the affected entries. It needs no WAL access, so it works on managed databases like Amazon RDS and Google Cloud SQL.

Will it touch my production database?

The Performance Advisor connects with read-only credentials and never changes your schema. You review and run any recommendation yourself. The proxy only sits in the path once you route traffic through it, and it starts in Passthrough mode, where nothing is cached.

How does it work with my existing setup?

DBO runs in your own infrastructure, installed with Helm or Terraform: the Performance Advisor as a lightweight agent in your Kubernetes cluster, and the proxy as a deployment you reach by changing your connection string. For PostgreSQL, enable pg_stat_statements first, which is a parameter group setting on RDS, a database flag on Cloud SQL, or shared_preload_libraries when self-hosted. MySQL deployments also support ECS.

How do I review changes before they apply?

DBO never applies index recommendations for you. Each one comes with the exact SQL, a plain-English explanation, and a before and after plan comparison showing the projected impact. For caching, Passthrough mode shows projected cache hit rates before anything is cached.

Does my data leave my environment?

Cached data stays in memory in your cluster, and query patterns are analyzed there. For query rewrites, the Performance Advisor sends only an anonymized query template to an LLM, with values and identifiers replaced by placeholders. No query values, results, or customer identifiers leave your cluster.

What are the limits of connection pooling on PostgreSQL?

For PostgreSQL, pooling runs in transaction mode, so session-level features don’t work through the proxy, including LISTEN/NOTIFY and session-level SET commands. Applications that use server-side prepared statements, which includes some Rails, Django, and Hibernate setups, need them disabled. Route connections that need these features around the pool.

What if the proxy becomes unavailable?

Run it as a deployment with at least two replicas and a PodDisruptionBudget. Connections drain gracefully during planned restarts, and you can fall back to the database by reverting the connection string host, with no code changes.

#1 on G2262 reviews

Find what’s slow before your users do

Start with a read-only look at your queries. Turn on caching when you’re ready.